Discover the Latest Insights on Ocean Health: Fascinating Updates You Need to See
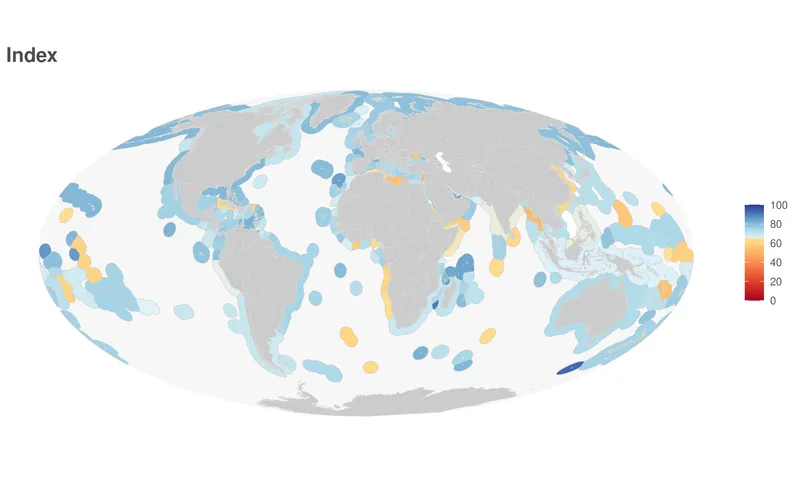
Imagine if we had a report card for the world's oceans, grading how well they're doing at providing us with food, clean beaches, jobs, and all that good stuff. That's exactly what the Ocean Health Index (OHI) does, and the fresh 2025 scores just dropped. The global average? A solid 72 out of 100. Not bad, right? It's like the ocean's getting a B this year.[1]
What's This OHI Thing Anyway?
Picture this: scientists from the Ocean Health Index team crunch numbers on 10 key goals that matter to all of us - things like catching fish sustainably, protecting coastlines from storms, storing carbon to fight climate change, keeping waters clean, boosting tourism, and even preserving that special "sense of place" we feel at the beach. They look at 220 coastal countries and territories, blending ecological, social, economic, and even political data to spit out these scores.[1][3][7]
The OHI is calculated by evaluating each of the 10 goals using specific data on current status, trends over time, and reference points representing the best possible outcome. For every goal, scores are derived from ecological, social, economic, and political factors, combined into sub-scores for current status (how well the goal is being achieved now), trend (recent changes), and resilience or other components where applicable. These are then aggregated using a formula that weights them and rescales to 0-100, with the overall index score being the mean of the 10 goal scores. The methods are detailed in their methodology documentation and open-source scripts, ensuring transparency, and past years' scores are recalculated with updated methods for comparability.[1][3]
- Data collection: Compile ecological, social, economic, and governance datasets for each coastal region and each goal, including time-series where available.[1]
- Define goals and indicators: For each of the 10 OHI goals, select specific measurable indicators (e.g., fish biomass for Food Provision, extent of coastal habitats for Coastal Protection) that represent the goal's benefits.[3]
- Set reference points: Establish goal-specific reference points representing ideal or sustainable conditions (the "best possible outcome") against which current status is compared.[1]
- Calculate current status: Compare observed indicator values to their reference points to derive a status score for each goal (how close current conditions are to the ideal), typically scaled 0 - 100.[1]
- Estimate trend: Analyze recent time-series data for each indicator to calculate a trend component that reflects whether the status is improving or declining over time.[1]
- Assess resilience and pressures: Quantify resilience measures (management actions, regulations, governance capacity) and pressures (threats like pollution, overfishing, or climate impacts) that influence future performance of each goal.[1]
- Combine components into goal scores: For each goal, integrate the status, trend, and resilience/pressure components using a defined formula to produce a goal score on a 0 - 100 scale.[1]
- Weighting and aggregation: Apply weights where specified and aggregate the 10 goal scores (typically by calculating the mean) to obtain the overall OHI score for each region, rescaling as needed to maintain a 0 - 100 range.[1]
- Recalculate historical scores: When methods or data are updated, recompute previous years' scores using the latest methods and inputs to ensure comparability over time.[1]
- Transparency and reproducibility: Publish the methodology documentation, score metadata, datasets, and open-source scripts so others can review, reproduce, and build on the calculations.[1]
It's their 14th year doing this, and they've got data stretching back to 2012. You can download it all for free (just give 'em a shoutout in your work). Every year, they tweak the methods with better data, but they recalculate old scores to keep everything apples-to-apples. Super transparent - they even share the scripts so anyone can geek out on how it's done.[1]
How Are Countries Stacking Up?
Some spots are killing it, like island paradises nailing tourism, carbon storage, and natural products. Think top scorers around 86 or so - places like Seychelles are acing it.[5] The U.S., for example, hits 72, beating the global average and ranking 60th out of 220.[4]
On the flip side, it's tougher in places like Eritrea (around 55), Ivory Coast, and Republic of the Congo. They struggle with food from the sea, coastal jobs, and protection from erosion. A lot of the lowest scores are in Africa and the Middle East, but hey, islands nearby are showing it's possible to turn things around.[5]
- Food Provision: How well are we harvesting seafood without wiping out stocks?
- Coastal Protection: Buffering shores from waves and storms.
- Clean Waters: Free from pollution for swimming and marine life.
- Biodiversity: Keeping the variety of ocean critters thriving.
- And more like tourism, artisanal fishing, and livelihoods![3]
Why Does This Matter to You and Me?
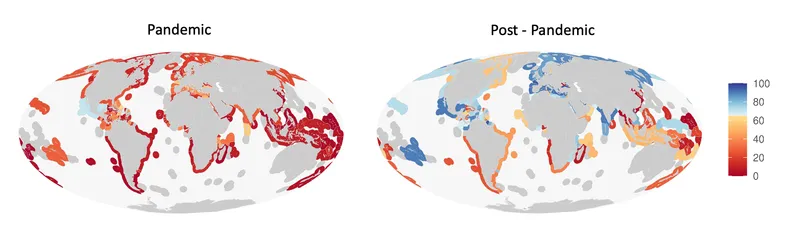
These scores aren't just numbers - they're a wake-up call for smarter ocean policies. Countries use them to tweak fishing rules, clean up beaches, or boost eco-tourism. Global scores have hovered steady-ish since 2012 (around 70-73), with dips from stuff like COVID hitting recreation hard in some years.[2][3] But the trend? It's a tool showing we can improve if we pay attention.
Want to dive deeper? Grab the data, play with interactive maps, and see how your corner of the coast scores. The ocean's health affects your next beach trip, your seafood dinner, and even the air we breathe. Pretty wild how connected it all is![1][7]
References

PADI Divemaster and underwater storyteller with over 7 years of hands-on Red Sea diving experience, documenting marine life, mapping dive sites, and promoting responsible ocean conservation.